
New report offers inspiration on reversing flat growth in Akron, Ohio
Above photo by Micolo J on Flickr.
Who wakes up every day thinking about the 62.4? Jack Knight did. I do too. For the first time in 28 years, we have a new mayor and a new administration doing the same. 62.4 is the size of the city of Akron in square miles. This piece of real estate, which gave birth to Knight Foundation, is the focus of a new report on the city’s economic health and competitiveness released today by the Greater Ohio Policy Center .
The center’s report, which was funded by Knight Foundation, complements recent findings from a task force appointed by Akron Mayor Daniel Horrigan. Over a 90-day period, a committee of 12 community leaders looked into the city’s operations and provided a high-level overview of strengths, weaknesses, opportunities and threats. While the mayor’s task force provided a physical exam revealing the city’s ailments, the Policy Center’s report is the first of many in-depth tests that help us better understand the scope of the city’s challenges. This report will also help us develop a plan to get better.
Most of the economic development data shared in our community is collected and compared at the county level. This is convenient for regional and statewide leaders, but the success of the suburbs in Summit County tends to mask the challenges of Akron, the county seat. In addition, we have lacked a sense of urgency because Akron has managed decline better than neighboring cities. The “62.4 Report” provides clear information that allows us to move beyond that. It shows Akron’s underperformance in recent years and highlights troubling trends that could negatively affect the city over the long term.
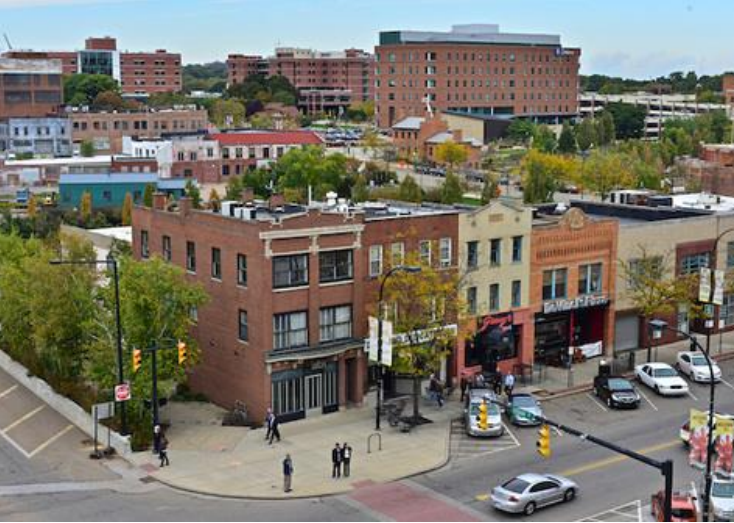
Akron. Photo via Greater Ohio Policy Center.
With Knight support, the Greater Ohio Policy Center compiled key economic indicators at the city level. Using those findings, the center benchmarked Akron against five cities based on their “size, similar histories of population loss and economic decline, and more recent trajectories of growth and regeneration.” The report examines each city’s decline from 1960 to 2000 and then its recovery from 2000 to 2013.
Population loss is a bellwether for how Akron compared on most indicators:Change in population, 1960 to 2000, and 2000 to 2013. Year of peak population Peak population 1960 population 2000 population 2013 population Percent change of population, 1960-2000 Percent change of population, 2000-2013 Akron 1960 290,351 290,351 217,088 199,038 –25.2%–8.3% Erie 1960 138,440 138,44 103,725 101,324 –25.1%–2.3% Fort Wayne* N/A N/A 161,776 205,727 254,435 27.2%23.7% Hamilton 1960 72,345 72,345 60,662 62,350 –16.2%2.8% Syracuse 1950 220,583 216,038 147,326 144,742 –31.8%–1.8% Worcester 1950 203,486 186,587 172,648 181,901 –7.5%5.4%* Fort Wayne has aggressively annexed surrounding areas, accounting for much of its population gain from 1960.Source: U.S. Census and American Community Survey.
Economists, such as Joe Cortright of City Observatory, have noted the importance of millennials in driving population growth and the revitalization of cities, but this hasn’t happened in Akron. Population growth among young professionals ages 25 to 34 was stagnant in our city from 2000 to 2013.Change in percent of cities’ total population made up by young professionals (people aged 25-34 with at lest a Bachelor’s Degree), 2000 to 2013. CITY 2000 percent of population that is a young professional 2013 percent of population that is a young professional Change in percent of population that is a young professional Percent change in percent of population that is a young professional Akron 3.3% 3.3% 0 0.0% Syracuse 4.6% 5.5% 0.91 19.9% Erie 3.2% 4.5% 1.3 41.0% Hamilton 1.8% 2.4% 0.6 33.9% Worcester 4.2% 5.8% 1.57 37.2% Fort Wayne 3.3% 3.7% 0.36 10.8% Source: U.S. Census and American Community Survey.
We must develop strategies to fix our flat growth and retain more young professionals. It’s one element of what we must do to help our city become more successful.
The “62.4 Report” also contains comparison data on employment, poverty, income, gross domestic product, foreign-born residents, long-term vacancy, households and housing units. Researchers also interviewed 12 Akron community leaders to understand the context of the findings.
The good news is there are strategies working in cities across the country, and the report includes case studies that outline some of the tactics they have pursued to stage turnarounds. Akron, too, can stage its own comeback.
The city has done it before—and we will do it again. In his biography on Jack Knight, Charles Whited quotes one of Jack’s columns from Dec. 23, 1936, where he described Akron “as a town of uncommon resiliency.”
“Akron reminds me of boxer “Rubberman” Johnny Risko in his palmy days. He was awkward, wide open half the time and swung from the floor. Better boxers beat a steady tattoo against his ribs and sent him sprawling to the mat. But the bell usually found him back on his feet. Akron is like that. The city has taken heavy punishment; but like good old barrel-chested Johnny Risko, we’re still in there fighting.”
Akron’s been knocked down, but we continue to get back up. Right now, we’re on our feet, and we’re still in there, fighting.
Kyle Kutuchief is Akron program director for Knight Foundation. Email him via [email protected], and follow him on Twitter @KyleKutuchief.
Recent Content
-
 Community Impactarticle ·
 -
 Community Impactarticle ·
 -
 Community Impactarticle ·