
A study to assess the relationship between diversity of ownership and diversity of portfolio management teams in asset management firms
EXECUTIVE SUMMARY
The Knight Foundation Diversity of Asset Management (KDAM) research series, which includes this report, coincides with a lively public discourse on racial, ethnic and gender inequality in this country. At the demand of stakeholders, institutional asset allocators now commonly evaluate firm diversity when selecting portfolio managers. Many philanthropies and universities are aligning their endowments with their values. This activity is accompanied by research that finds no statistically significant difference in risk-adjusted returns between diverse and non-diverse asset management firms, and mounting evidence that diverse companies have better business outcomes. For those with fiduciary duty, addressing inequality is not only about social justice but also about realizing the talent of underutilized women and minority groups.
Clear and reliable metrics are critical to understanding firm diversity and monitoring change over time. But data is far from complete. And there is no consensus on how to measure diversity in the first place: one may prefer to measure by ownership diversity, by decision maker diversity or by something else entirely. There are numerous valid possibilities.
Diversity of ownership is the most widely available metric in third-party data. The KDAM studies to date have focused on diversity of ownership, due in part to its virtues, as described in the next section, and its availability. Several foundations that participated in the KDAM studies and other interested parties have asked whether alternative metrics––namely, decision maker diversity––could or should be used instead. In response to such inquiries, this report takes a closer look at the ownership metric with respect to new data on decision maker diversity recently released by eVestment.
The new data provides the racial, ethnic and gender composition of portfolio management teams (“teams”) for a sample of firms. We use the data to study (1) the statistical link between ownership and team diversity, (2) the relative diverse representation in ownership and on teams and (3) gender representation on teams. The analysis considers a sample of 204 active, non-public U.S.-based firms, which manage 1,450 public equity, fixed income and hedge fund products from U.S.-based offices. The firms collectively hold $3 trillion in assets under management (AUM) and employ a total of 11,300 people.
Analysis 1: There Is a Strong Positive Correlation Between the Ownership and Team Metrics
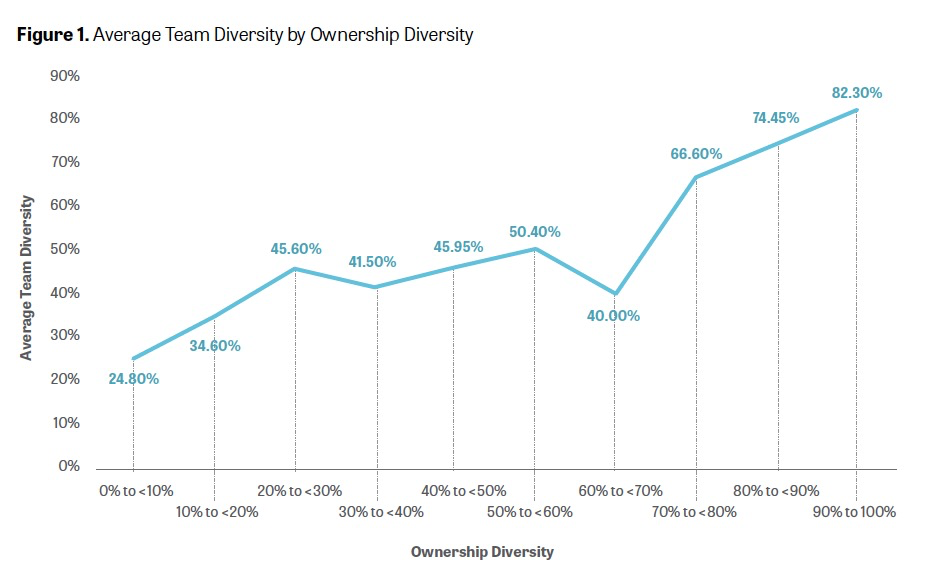
Statistical evaluation of the relationship between the ownership (equity %) and team (headcount %) metrics suggests that ownership diversity is indicative of team diversity. Figure 1 shows the average team diversity by ownership diversity. The positive relationship can be observed simply by looking at the data: Team diversity increases with ownership diversity.
Key Findings
- There is a strong and statistically significant positive correlation between ownership diversity and team diversity. This means the higher the ownership diversity, the higher the team diversity, on average, and vice versa. This relationship holds even after controlling for firm size, the share of employees that are owners and the domiciled state.
- Diverse-owned firms are at least 3x more likely to have a diverse team compared to non-diverse-owned firms.
- If an asset allocator hired a diverse-owned firm at random without knowing anything else about it, there is a 75% chance the firm has a diverse team.
Analysis 2: Diverse Representation Is Greater on Teams Than in Ownership, Overall
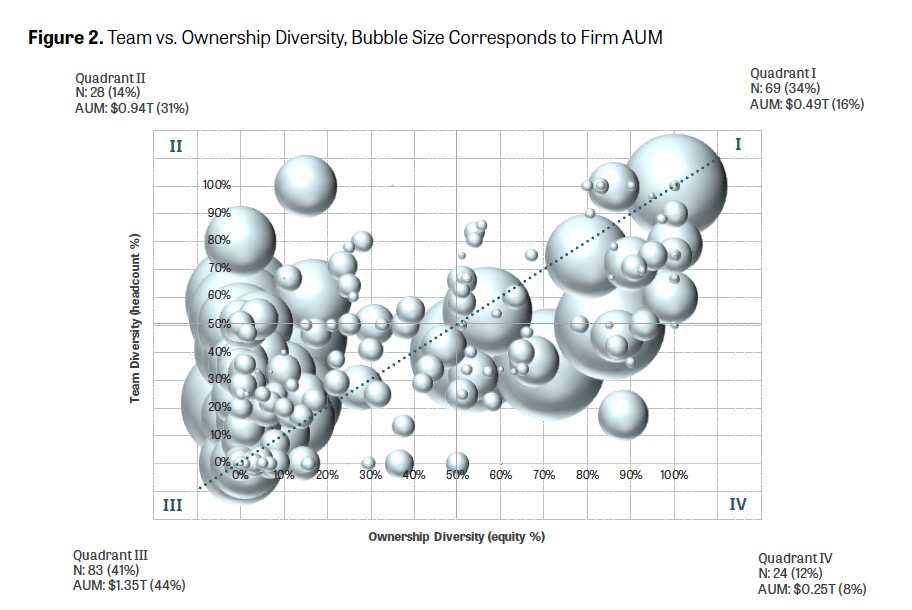
Holistic evaluation of the firms in the dataset uncovers overarching trends in diverse representation. Figure 2 shows a scatter plot of team and ownership diversity for the sample of 204 firms, with the bubble size corresponding to firm AUM. Diverse-owned firms are in Quadrants I and IV. Non-diverse-owned firms are in Quadrants II and III. Firms with diverse teams are in Quadrants I and II. The red dashed line at 45-degrees indicates “team-ownership parity,” where ownership diversity is equal to team diversity at any point along the line. Firms above the line have greater team diversity than ownership diversity; firms below the line have greater ownership diversity than team diversity.
Key Findings
- Diverse-owned firms are nearer to team-ownership parity compared to non-diverse-owned firms, with team diversity levels at or just below ownership diversity levels.
- Non-diverse-owned firms are consistently above the parity line, with relatively high team diversity and low ownership diversity. In addition, non-diverse-owned firms are larger than diverse-owned firms ($20.7 billion vs. $8 billion, on average) and therefore contribute substantially to the large imbalance between team and ownership representation across the firms in the sample when measured by AUM.
- Diverse representation is greater on teams than in ownership for all diverse groups, but the difference is most pronounced for the Asian minority group. At non-diverse-owned firms, for example, the Asian minority group manages seventeen times the amount of AUM it owns.
Analysis 3: Women Are Vastly Underrepresented on Teams
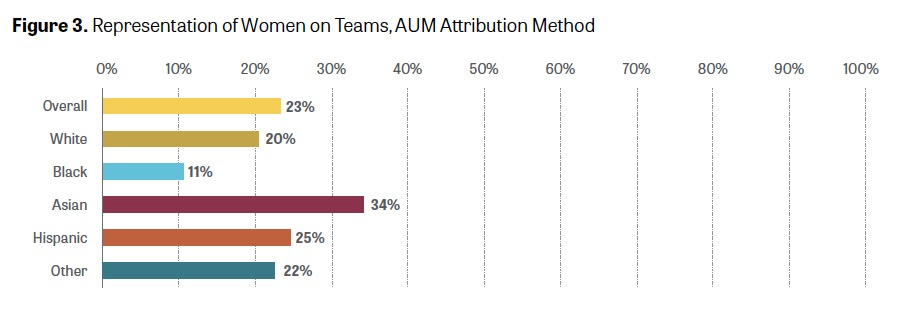
Evaluation of team representation at the intersection of race/ethnicity and gender reveals stark gender disparity on teams (the ownership data does not provide a gender breakdown for minorities), even among this self-selecting group of highly diverse firms. Figure 3 shows team gender representation, by race and ethnicity.
Key Findings
- Women manage 23% of the AUM in the sample.
- The Asian minority group is nearest to gender parity (though still not particularly close to it): Asian women manage 34% of the $0.64 trillion in Asian-managed AUM.
- The Black minority group is furthest from gender parity: Black women manage 11% of the $0.08 trillion in Black-managed AUM.
Concluding Remarks
Although further analysis is needed as diversity data becomes more complete, this report offers statistical evidence that ownership diversity has a strong positive correlation with team diversity at the firm level. Furthermore, it shows that, in terms of total AUM, diverse representation is greater on teams than in ownership. This differential is driven by (1) diverse representation on teams at large firms with zero or relatively low ownership diversity and (2) greater representation on teams of certain groups relative to others––namely, a high percentage of diverse team members come from the Asian minority group. Women of all races and ethnicities––and, in particular, Black women––are underrepresented relative to their respective proportion of the total U.S. population.
In the News


How Black Asset Manager Is Using Acquisitions and New Ventures to Scale Up

Research Vital To Presenting Diverse Manager Disparities: Knight Foundation – FIN News

Black Asset Managers and the Fight for Investment Capital | Chicago Defender