
Full Reports
Summary
Healthy news and information ecosystems are critical to healthy communities. Research and experience have shown that communities that have significant amounts of relevant, quality news and information have greater levels of civic engagement, more community cohesion and greater government accountability. In late 2022 and early 2023, Impact Architects applied the Healthy News and Information Ecosystem assessment framework to eight Knight resident communities. For five of these cities—Charlotte, NC; Detroit, MI; Macon-Bibb County, GA; Miami, FL; andPhiladelphia, PA—this was the second application of the framework and we are able to observe change over time from 2020 through 2022. For three communities—Akron, OH; San José, CA; and St. Paul, MN—this application serves as a baselining of the ecosystem.
From 2020 through 2022, the main headline in each Knight community was, unsurprisingly, the ways in which COVID-19 impacted everything from education and local government to health care and the media. COVID-19 strained journalism organizations in many of the same ways it did other institutions—to go fully remote, adapt workflows, etc — but it also forced journalists to reconsider how they could cover or engage with communities at a time when, paradoxically, reporting was more challenging than ever but the local information was more important than ever. COVID-19 reinforced the media’s role as a key feature in any community’s ecosystem, sometimes making the difference between life and death.
Information needs assessments, which help understand the presence, relevance and access of local media from the perspective of community members, have been conducted in only three of the Knight communities — Detroit, Macon-Bibb and Philadelphia. These assessments serve as a helpful baseline for identifying gaps and opportunities for news organizations, both existing and startups. There is opportunity for Knight and other partners to support information needs assessments in communities where they have not yet been conducted, particularly communities that are large and diverse and thus have many information needs.
The original report was conducted in the midst of the national racial reckoning in 2020 after the murder of George Floyd in Minneapolis (which had a particularly significant impact in the adjacent Knight city of St. Paul). At that point in time, news organizations around the country were motivated to launch or revamp diversity, equity and inclusion initiatives,both in reporting and in internal processes within organizations. In this 2023 assessment, we found that, in most cases, it’s too early to say whether these commitments are having lasting impacts. For example, in 2020, Gannett daily newspapers committed to having staff that reflected their communities demographically; however, publications’ leaders said in interviews that it’s proven difficult to diversify staff while also conducting layoffs and buyouts. And with ever-lessening resources, recruitment and retention continue to be a challenge for all news organizations.
In many Knight communities, we heard that access to local news outlets does not mean there is necessarily local coverage and reporting. National newspaper chains have contracted and consolidated to such an extent that even when there is still a local daily paper, the staffs have been reduced and are unable to cover the community to the extent they had historically, let alone provide adequate coverage for communities previously neglected. Similarly, nationaltelevision stations with local affiliates often don’t have resources to fully cover a community, or an institutional legacy of doing so.
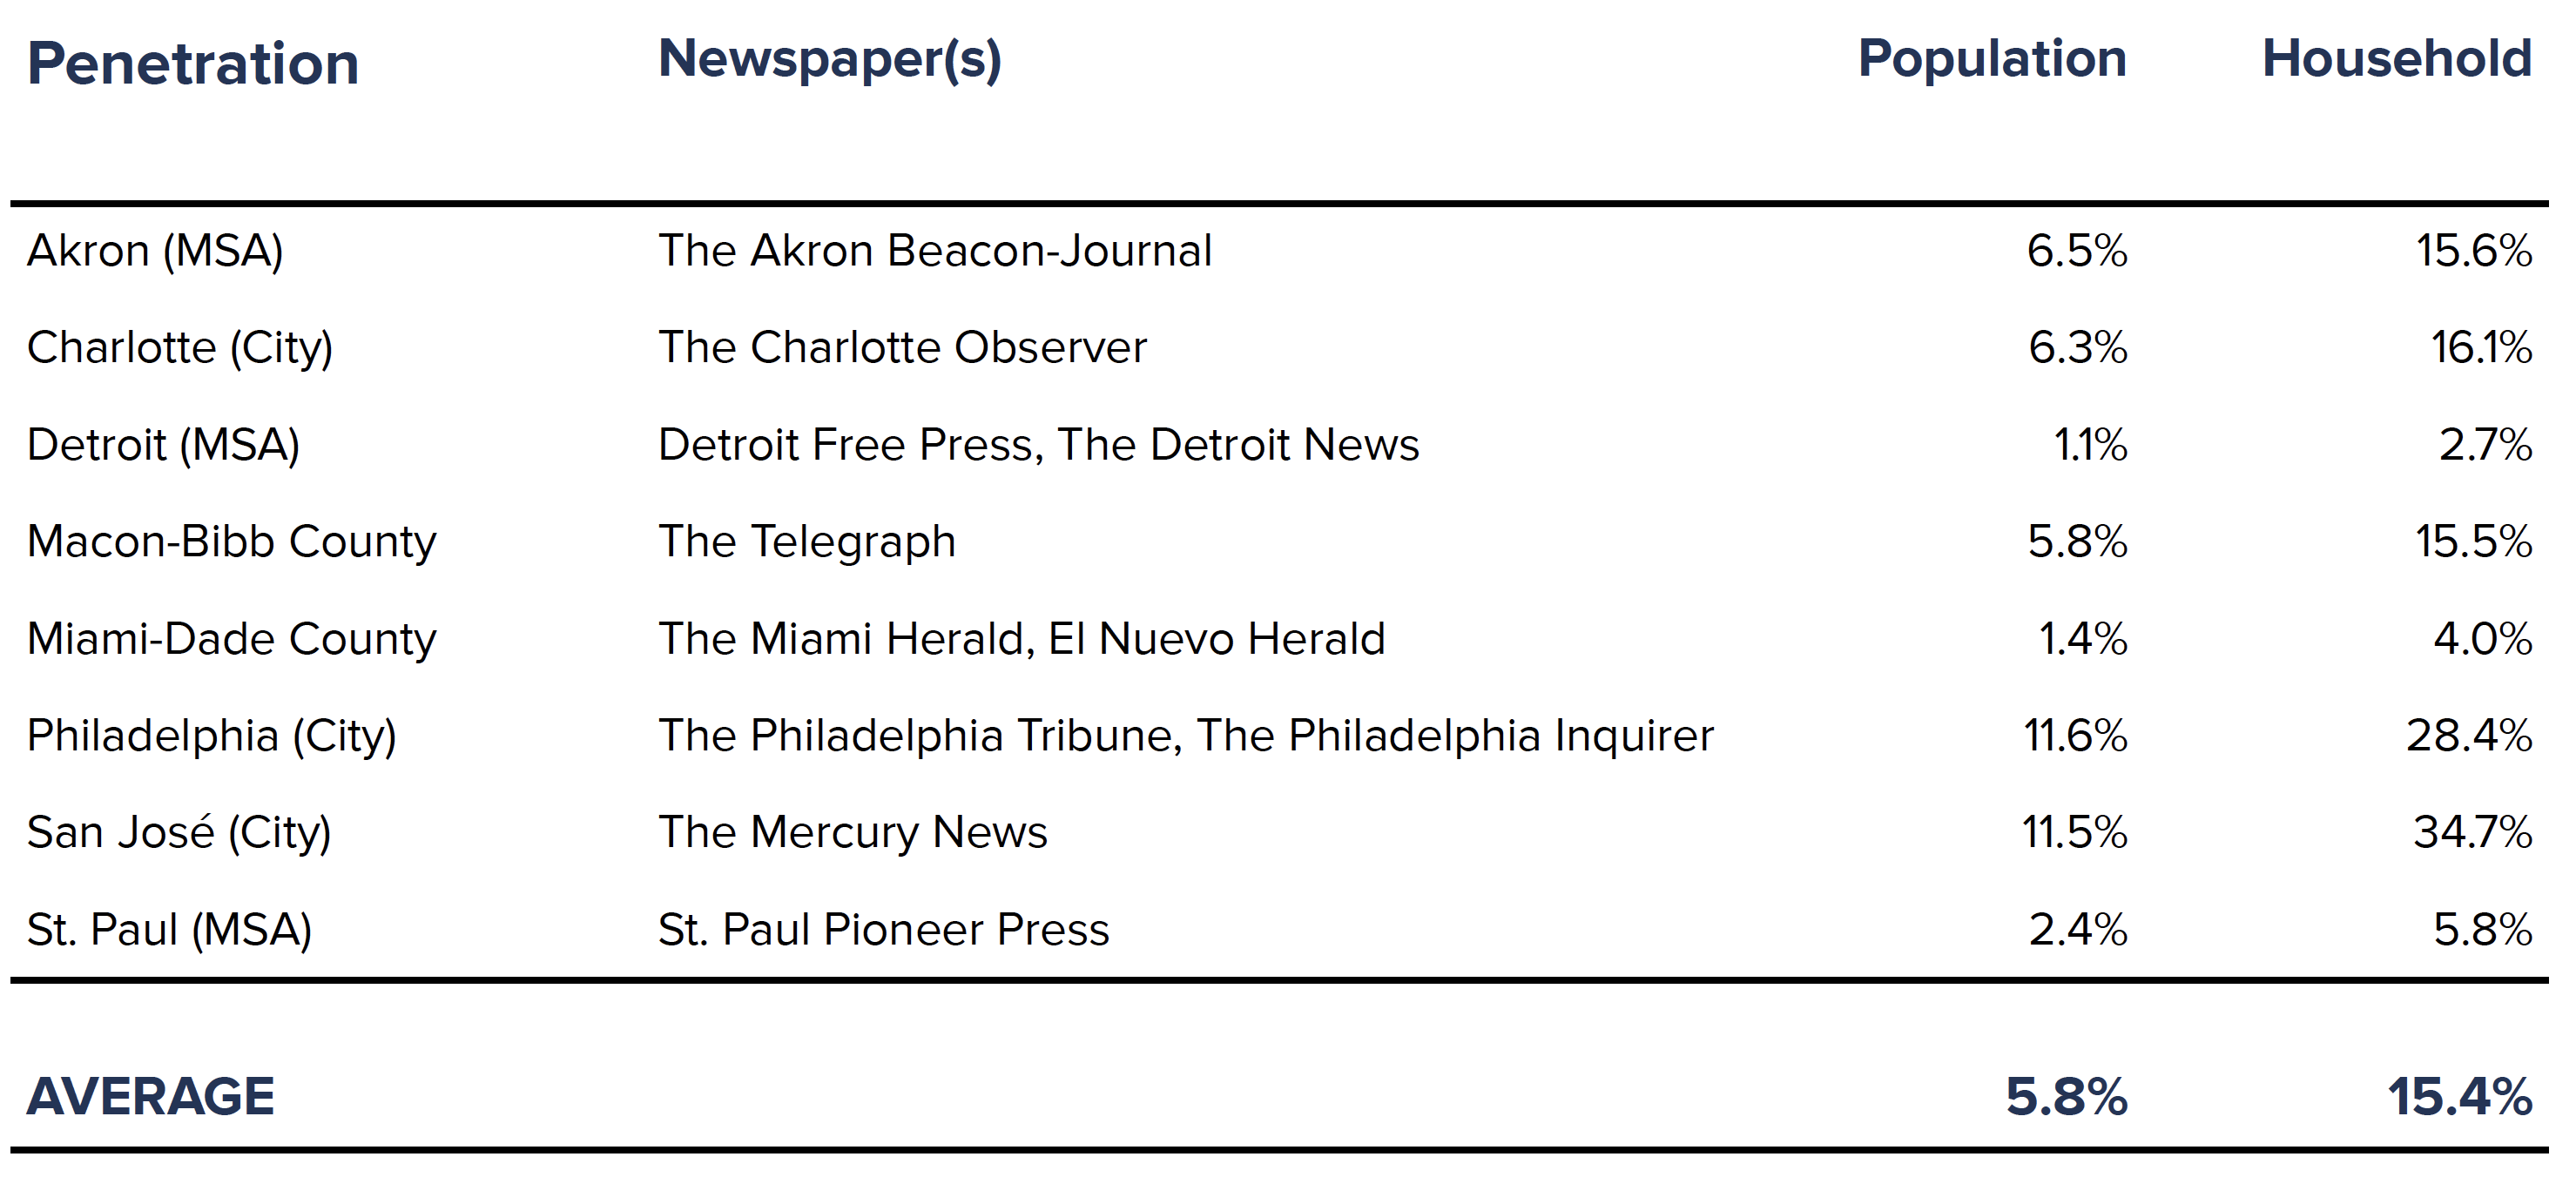
We accessed Alliance for Audited Media data in order to better understand newspaper consumption (print, digital replica and digital nonreplica) in each community. While these data are for the major daily newspapers only, meaning they do not include the reach of broadcast TV or radio or digital news and information, they are helpful in understanding the presence of major dailies in each community. Using these circulation rates and the size of the population and number ofhouseholds in each city, we calculated the penetration rate of newspapers in each. Among the Knight communities, the average penetration rate for the population was 5.8%, while it was 15.2% for households, with Philadelphia and San José standing out with household penetration rates of 28.4% and 34.7%, respectively, and Detroit and Miami with the lowest rates of 1.5% and 4%. Throughout this report, we’ll refer to household penetration rate.1
We found that community and ethnic media often serve immigrant and diasporic communities with information about countries of origin, but not necessarily about the local community, particularly in those Knight communities that are large, complex, and diverse ecosystems like San José, Philadelphia and Miami. Furthermore, these media are often not connected to other networks and collaborative efforts that would enable them to share content and sources and report collaboratively.There is opportunity for Knight and other local partners to support these community and ethnic media directly, as well as through collaborative efforts, in order to build stronger relationships across the ecosystem and facilitate more local reporting across diverse sectors of the community.
While some cities have strong collaborative networks throughout the media ecosystem, in others there is little to no collaboration happening. In this ecosystem assessment, as well as in other research, we found the strongest collaboration to be where there are (or were) backbone institutions specifically tasked with maintaining and coordinating the collaborative, such as Macon’s Mercer University’s Center for Collaborative Journalism and the Charlotte Journalism Collaborative or the previous Broke in Philly and Detroit Journalism Collaborative initiatives. There is opportunity for Knight and others to fund backbone institutions that support the whole ecosystem through things like coordination, project management, pooled funding and other resources, and collaborative initiatives in those communities where they have not yet developed.
For each city, we have made a top-line assessment about the strength of the ecosystem with respect to information providers, community, and information providers and community. For the five cities where we observed change over time, we have identified if they remain steady, are improving or are declining for each of the three categories. And for new cities where we set baselines, we have indicated if they are strong, average or have opportunity for growth in each of the three categories. This information is presented in the following table.
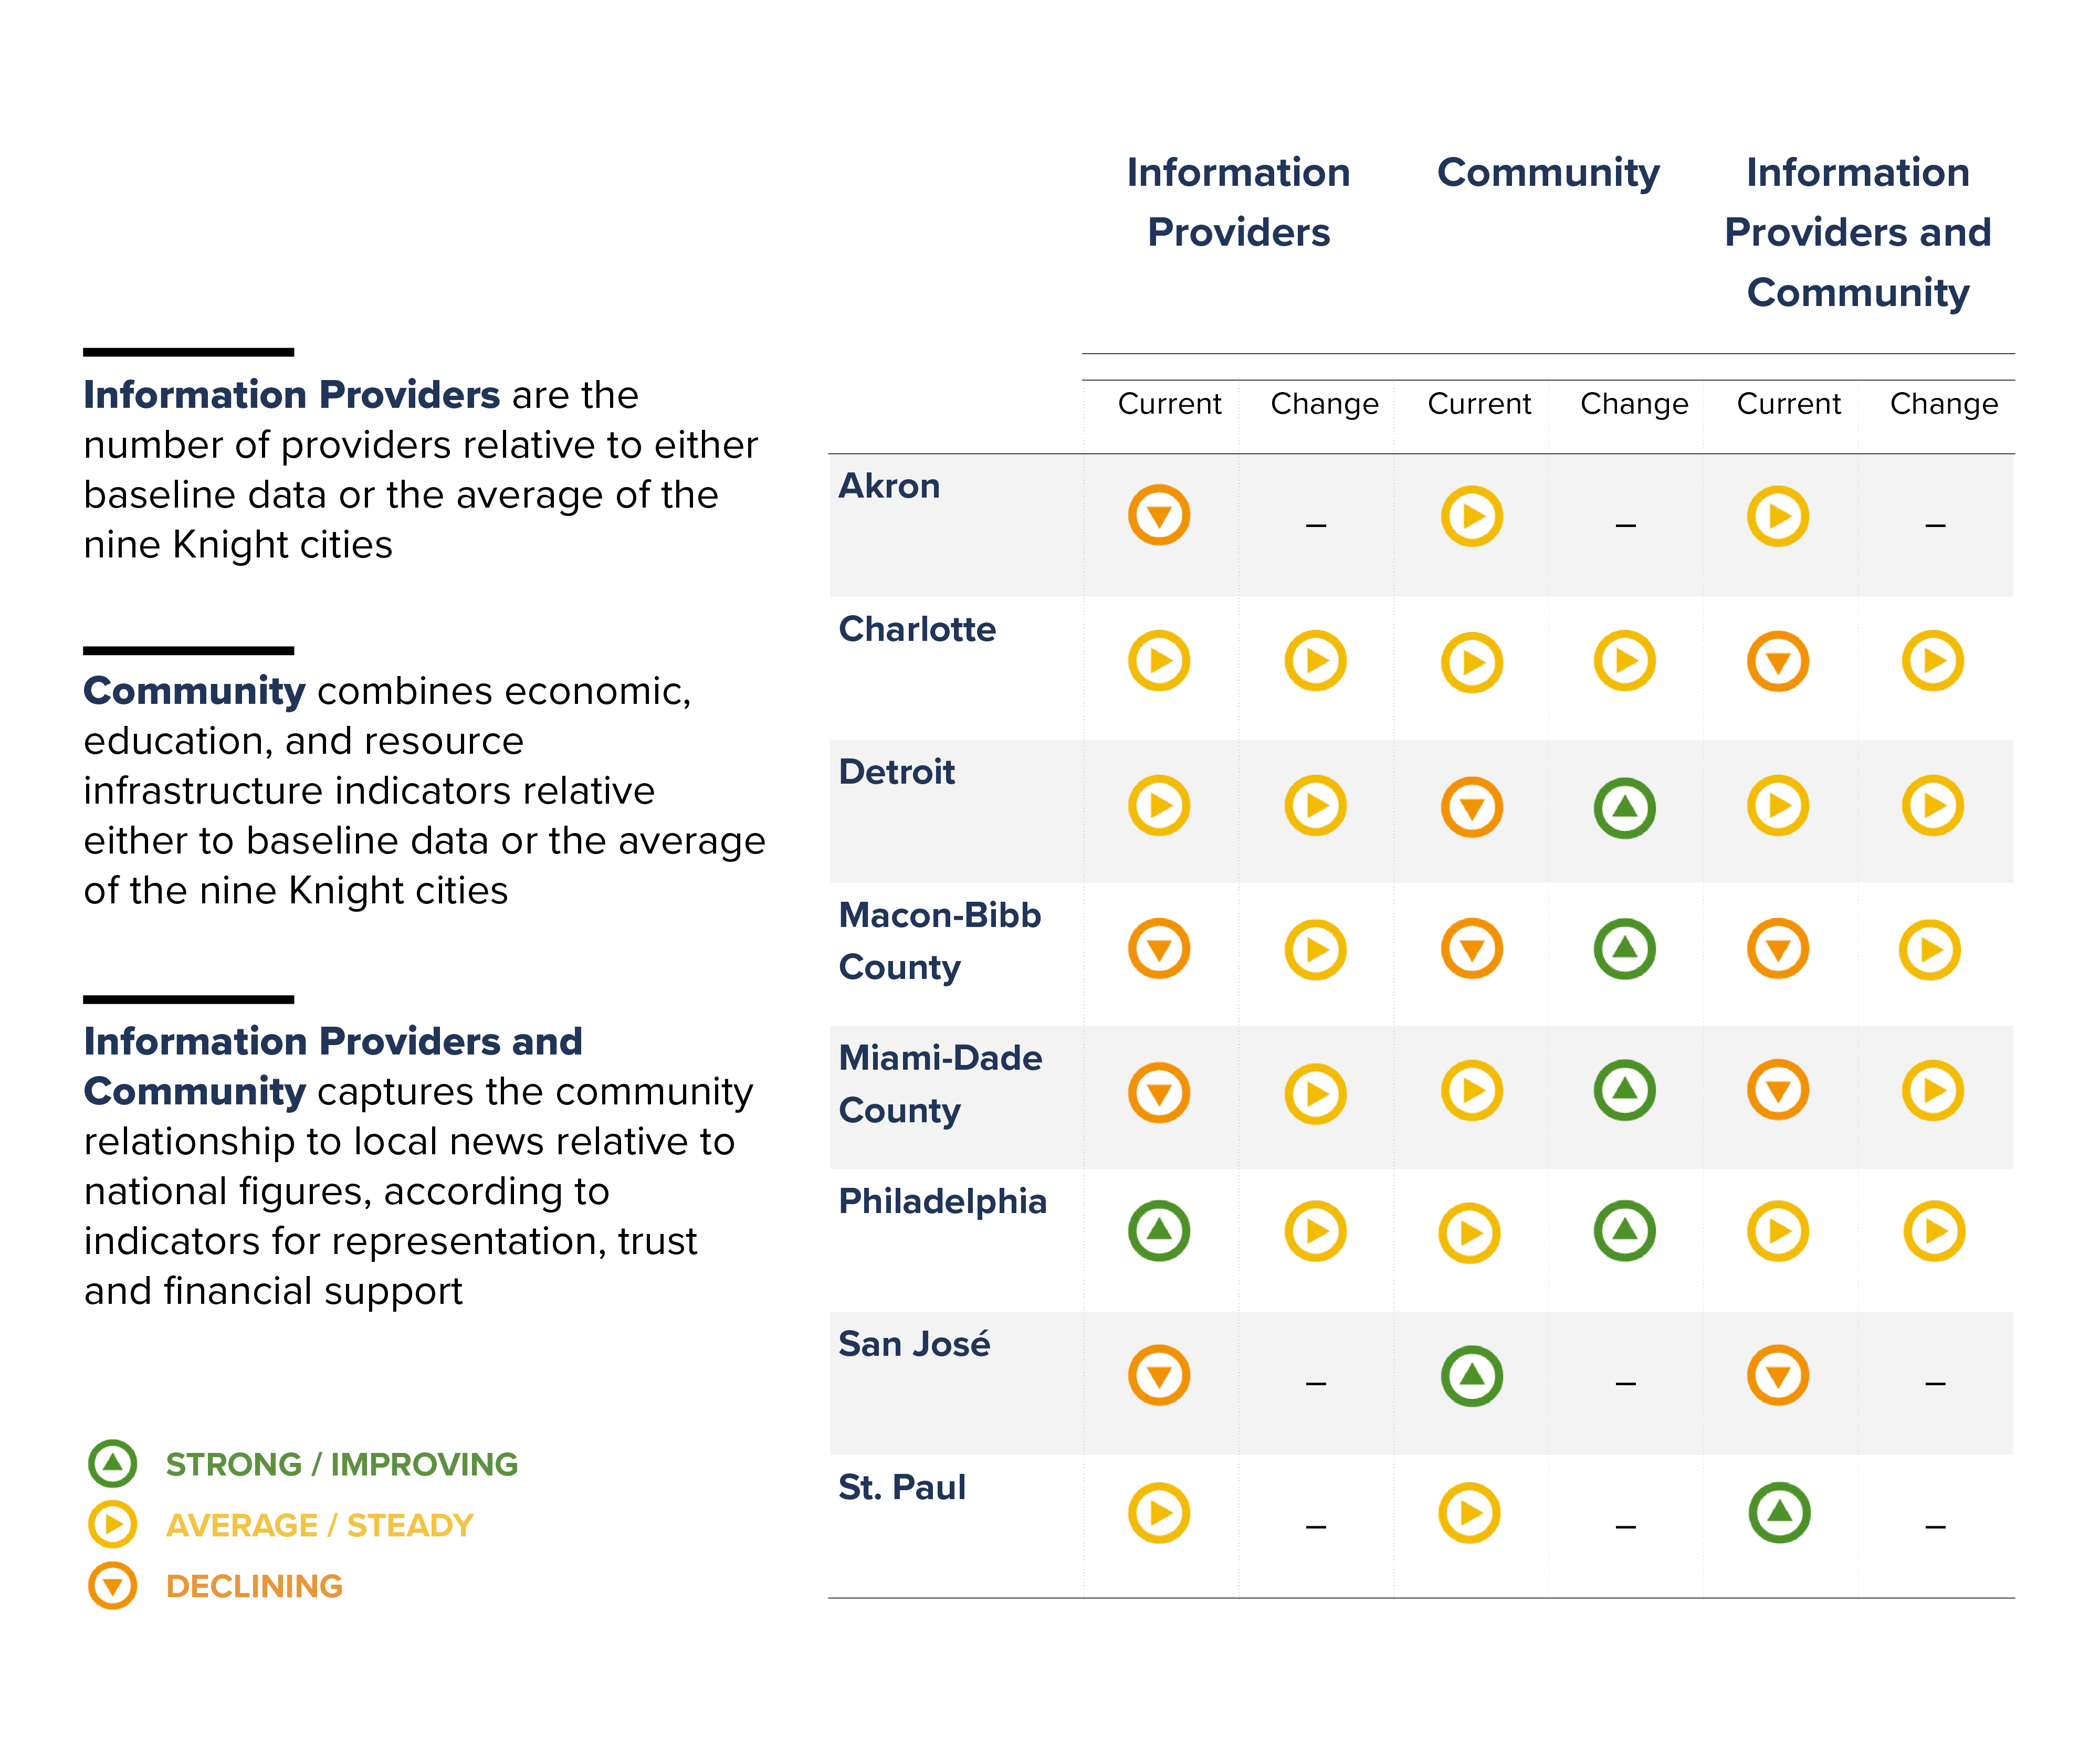
Overall, the eight Knight communities’ news ecosystems are trending in the right direction. For all five that were baselined in 2020, the information providers have remained steady, with some contraction in the commercial sector and some growth in the nonprofit sector. For those communities that were baselined, both the Akron and San José information providers have significant opportunity to grow to better serve these diverse communities—and Knight’s investment in the expansion of Signal Ohio to Akron is a step in the right direction. And even while St. Paul has a robust sector of information providers, there is still opportunity to increase collaboration in the ecosystem.
In four of the five original communities, community indicators have improved since 2020, meaning poverty levels have declined and income is on the rise, and the fifth (Charlotte) has remained steady. And for those new communities, their community indicators are on par with the average of the eight Knight resident communities.
Footnote
- The penetration rate for the population and households was calculated by dividing the average daily circulation of
print, print replica and nonprint replica, as reported by the Alliance for Audited Media, by the total population and the
total number of households in each location, according to the 2021 American Community Survey (ACS).