
Circle of Transparency/Participating Foundations
Bill & Melinda Gates Foundation, The Robert Wood Johnson Foundation, Silicon Valley Community Foundation, W.K. Kellogg Foundation, The Andrew W. Mellon Foundation, John D. and Catherine T. MacArthur Foundation, The Leona M. and Harry B. Helmsley Charitable Trust, Walton Family Foundation, Tulsa Community Foundation/George Kaiser Family Foundation, The Rockefeller Foundation, The JPB Foundation, The California Endowment, The Kresge Foundation, The Duke Endowment, Carnegie Corporation of New York, The Chicago Community Trust, The Carl Victor Page Memorial Foundation, John Templeton Foundation, The Harry and Jeanette Weinberg Foundation, The Annie E. Casey Foundation, The New York Community Trust, Richard King Mellon Foundation, Ewing Marion Kauffman Foundation, The William Penn Foundation, The Wyss Foundation, Foundation for the Carolinas, Cleveland Foundation,McKnight Foundation, Casey Family Programs, John S. and James L. Knight Foundation, Charles Stewart Mott Foundation, Conrad N. Hilton Foundation, The James Irvine Foundation
Declined to participate/Did not respond
Ford Foundation, The William and Flora Hewlett Foundation, The David and Lucile Packard Foundation, Gordon and Betty Moore Foundation, Simons Foundation, Margaret A. Cargill Foundation, Charles and Lynn Schusterman Family Foundation, Oregon Community Foundation, Laura and John Arnold Foundation
Assets not externally managed
Lilly Endowment Inc., Foundation to Promote Open Society, Bloomberg Family Foundation Inc., Chan Zuckerberg Foundation, Robert W. Woodruff Foundation, Open Society Institute, Greater Kansas City Community Foundation, Kimbell Art Foundation
Foreword from Knight Foundation
In early 2010, we were publicly asked how much of Knight Foundation’s $2.1 billion endowment was invested by asset managers whose ownership included people of color or women. We had never previously been explicitly asked, nor had we explicitly asked ourselves, this question, but, given our values and the size of our endowment, we assumed the number would be material.
We were wrong. The answer then was $7.5 million, managed by a single firm. The answer today is $931 million, or more than one-third of our current endowment.
Like many leading independent foundations, we have an explicit commitment to equity and inclusion in our grant-making program. But our program spending is just a percentage of the assets we manage. As with all foundations, it is our assets, mainly a privately managed endowment, that yield the resources to invest in our programs.
There are many ways to consider how values of diversity, equity and inclusion can manifest in the management of an endowment. We believe the question of diverse ownership, while not the only factor, is an important one. In finance, firm owners reap great dividends from the value they create, and it is owners who have the greatest influence on how the capital they manage is invested and on the makeup of their investment teams. Finance is fundamentally about equity—that is, who owns the capital. And our values argued for a more equitable distribution of the equity, so we resolved to do that.
Because we believe this conversation is so critical, two years ago, we posed the question: What is the representation of diverse-owned asset managers among philanthropic endowments?
In response, Global Economics Group designed a study to assess the representation of women- and minority-owned firms among asset managers used by the country’s top 50 charitable endowments, which collectively represented endowment assets of $290.3 billion at the time. It found that study participants invested with diverse-owned firms at a higher rate than the asset management industry. The report also caused significant discussion and introspection in the field of philanthropy and beyond. And, it has accelerated calls for more equitable distribution of opportunity among those managing the money of some of the largest philanthropic organizations in the world. We have updated this study in order to continue to encourage transparency and to monitor change in how foundations are investing their endowments.
We thank the foundations who have participated in this study, either by directly providing data or by making the information available on their IRS Form 990. The goal of this report is to inform a conversation—one that we hope will improve our collective understanding, promote diversity in asset management and enhance the available data in the field. And that, in turn, will lead to a more equitable distribution of the equity generated by private foundation endowments.
Juan Martinez, Vice President/Chief Financial Officer
Ashley Zohn, Vice President/Learning and Impact
Executive Summary
In early 2020, Knight Foundation and Global Economics Group released a study on the diversity of the asset managers used by the United States’ top 50 charitable foundations. Earlier this year, Knight Foundation asked Global Economics Group to refresh the study to assess the representation of diverse asset managers among foundations and begin to track changes in representation over time.
The 2021 study assesses the representation of investment firms owned by women or members of racial or ethnic minority groups in the United States (“diverse-owned firms”) among investment firms used by the country’s top 55 charitable foundations in terms of total asset size. The top 55 foundations account for over $300 billion in total assets, collectively, including investment assets. We included five additional foundations so that all foundations that were among the top 50 in the 2020 study could be studied over time. In addition, based on both investor and manager feedback, we raised the threshold for what is considered diverse ownership from more than 0% to 50% or more, a threshold set by the commonly used industry databases.
In refreshing this study, we have a more complete picture of the diversity in asset management in the nation’s largest foundations. We observe: (1) increased investing with diverse-owned firms overall among the 25 foundations that participated in both studies and (2) higher foundation participation, with five new foundations engaging in the study revealing an additional $11.03 billion in invested assets under management. That said, there is still room for improvement in study participation, as 14 out of the top 55 foundations elected not to disclose diversity statistics or data at all.
The study analyzes available endowment investment data for 30 of the top 55 foundations (“Participating Foundations”) and includes only endowment investments managed by investment firms based in the United States (“Analyzed AUM”), amounting to $66.73 billion.
Using a higher threshold of diverse ownership this year, the study finds:
- $11.07 billion (16.6%) is invested with diverse-owned firms.1
- $6.24 billion (9.3%) is invested with women-owned firms and $6.70 billion (10.0%) is invested with minority-owned firms, as defined in Appendix A.2
- The average foundation (in terms of a simple average) invests 16.3% of its assets in diverse-owned firms, and the median foundation invests 16.0% in diverse-owned firms.
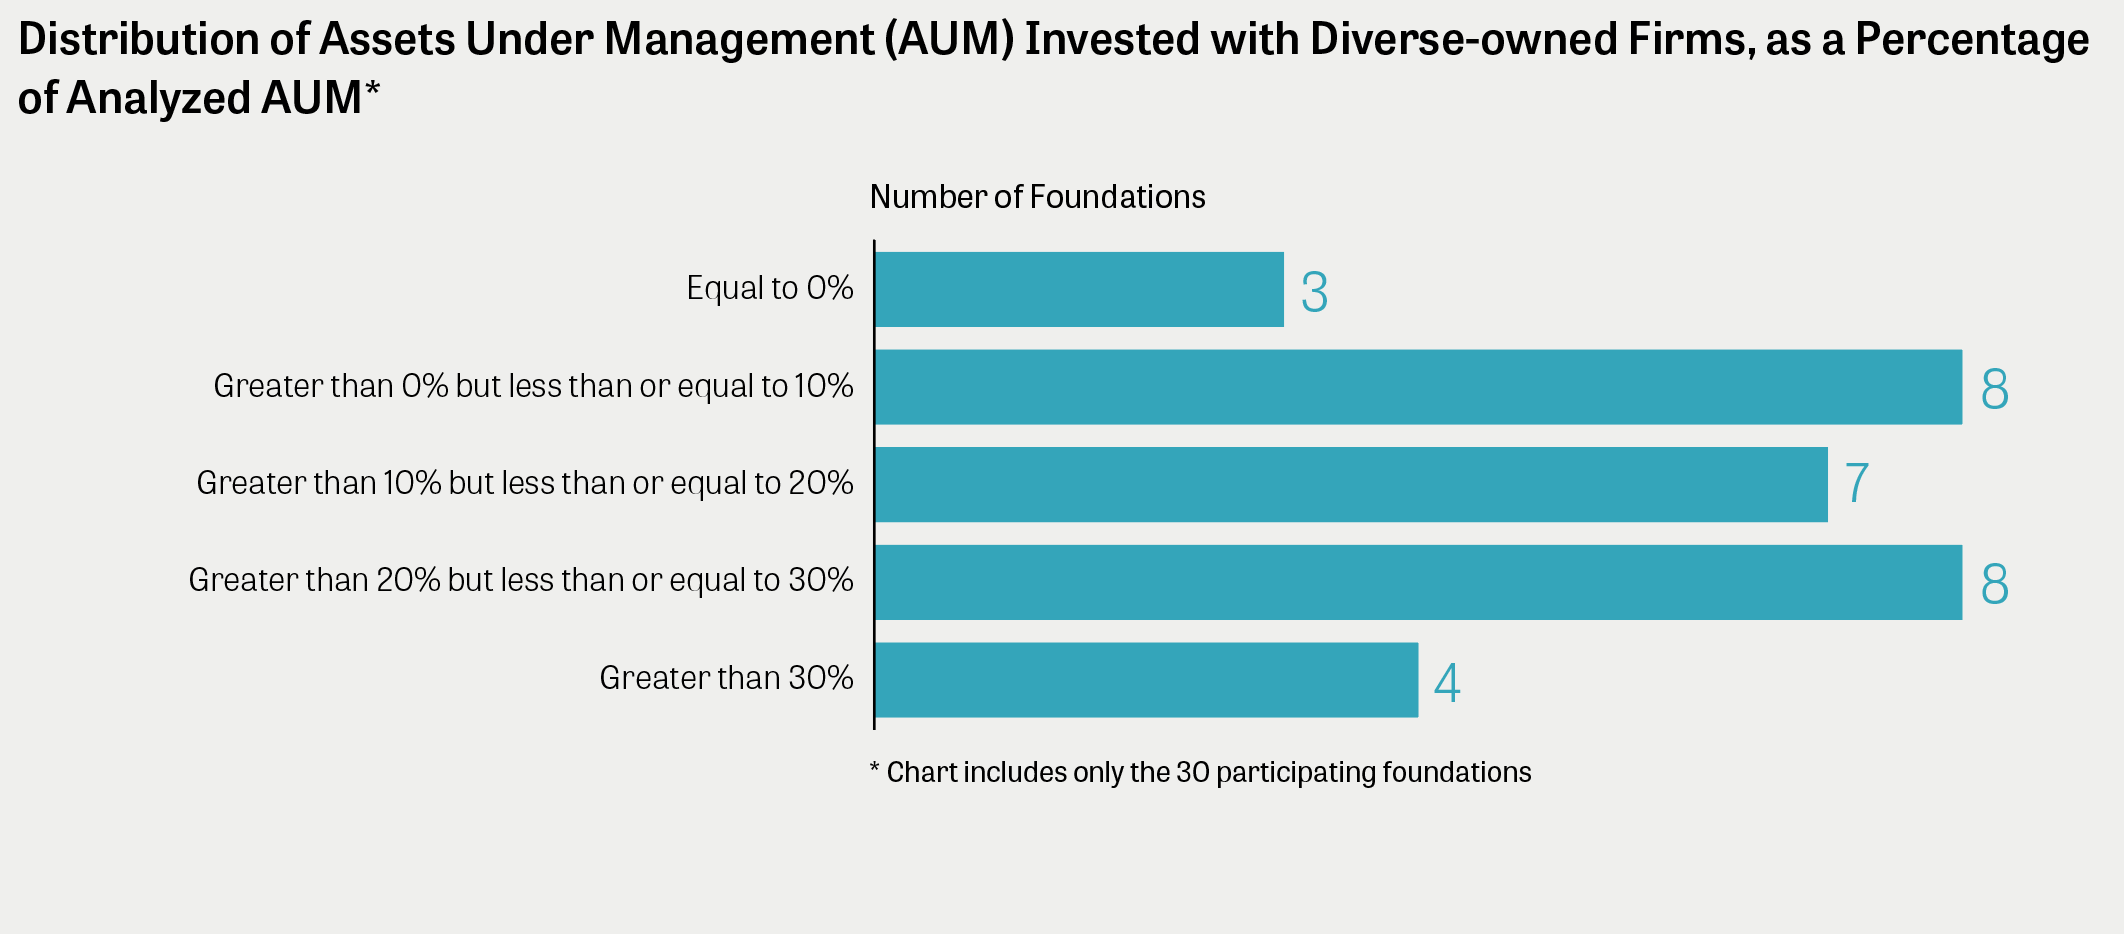
- As the histogram below shows, all but three (90%) of the 30 Participating Foundations invest some portion of their assets with diverse-owned firms. Nineteen (63.3%) invest more than 10% of their assets with such firms. Four foundations (13.3%) invest more than 30% of their assets with diverse-owned firms.
Based on participant feedback, we also conducted a second version of the diversity analysis that excludes publicly traded firms and Vanguard (a widely held firm, owned by its investors) and focuses on traditionally held, non-public firms for which we know the ownership composition. Excluding those firms reduced Analyzed AUM by $9.81 billion to $56.92 billion for the 30 foundations. Overall, because this analysis removes $9.81 billion in predominately non-diverse firms from the denominator of the calculation, the share of the foundation’s portfolio that is invested with diverse-owned firms increases.
Of the $56.92 billion in Analyzed AUM that is invested with non-widely held, non-public firms:
- $11.02 billion (19.4%) is invested with diverse-owned firms.
- $6.24 billion (11.0%) is invested with women-owned firms and $6.64 billion (11.7%) is invested with minority-owned firms, as defined in Appendix A.3
- The average foundation (in terms of a simple average) invests 18.9% of its assets in diverse-owned firms, and the median foundation invests 16.7% in diverse-owned firms.
While the study is based on the diversity of investment firm ownership, we acknowledge that there are many other ways to measure and express diversity. The study is limited by the available data. In an ideal world, we would have access to various diversity metrics for each investment firm used by the foundations—for example, diversity of ownership, diversity of the workforce, and diversity of influence and decision making—and expressed in terms of the most granular variations of gender, race, ethnicity, and more. In the absence of such data, we adopt the diversity metric most widely collected and provided by the third-party data providers Preqin and eVestment, which is reported in terms of ownership for the basic breakdowns of gender, race and ethnicity.
Recently, eVestment has begun to collect data on portfolio management team diversity for a subset of the firms it covers. This new metric combined with the ownership diversity data allows for unique insight into the relationship between diversity of ownership and diversity of portfolio management teams. An analysis of the available data finds a strong positive correlation between the percentage of firm ownership held by diverse owners and the percentage of the firm’s portfolio management team composed of diverse team members. Applying a diversity threshold of 50% or more to ownership share and team composition, the analysis also finds that diverse-owned firms are nearly three times as likely to have diverse portfolio management teams than firms that are not diverse-owned.
The remainder of this report provides greater detail on the study to ensure that the process implemented is clear and replicable. This study is purely descriptive, based on a set of clearly defined rules as described in the Methodology section. The remainder of the report is structured as follows:
- Results of the 2021 Diversity of Asset Managers Study
- Comparison with the 2020 Diversity of Asset Managers in Philanthropy Study
- The Relationship between Diversity of Ownership and Diversity of Portfolio Management Teams
- Appendix A: Methodology
- Appendix B1: Detailed Results, Including Publicly Traded Firms and Vanguard
- Appendix B2: Detailed Results, Excluding Publicly Traded Firms and Vanguard
- Appendix C: Foundation Comments
- Appendix D: Notes on Available Data
Results of the 2021 Diversity of Asset Managers Study
The 2021 study assesses the representation of investment firms owned by women and members of racial or ethnic minority groups in the United States (“diverse-owned firms”) among investment firms used by the country’s top 55 charitable foundations in terms of total asset size. We selected the top 55 foundations in terms of the market value of total assets, according to data compiled by Candid in 20214. In comparison to the 2020 study, we included five additional foundations so that all foundations that were among the top 50 in the 2020 study could be analyzed over time. The top 55 foundations on the Candid list collectively hold $300.34 billion in total assets and consist of the following organizational types:
- 42 independent foundations,
- 9 community foundations and
- 4 operating foundations.
Of the top 55 foundations, we were able to compile and analyze investment data for 30 foundations, either by accessing the data through publicly available sources (IRS Form 990 or 990-PF) or through direct voluntary submissions by Participating Foundations. Such investment data amounts to $66.73 billion in Analyzed AUM invested with over 800 distinct asset managers. Additionally, three foundations chose to self-report diversity statistics, bringing the total number of foundations fully or partially participating to 33.5
Of the remaining 22 foundations whose investment data are not included in the study:
- 8 had investment portfolios that were not managed by external managers and therefore were not analyzed in the study,
- 9 had insufficient publicly available data and declined to participate in the study for a variety of reasons, including contractual nondisclosure agreements with fund managers, and
- 5 had insufficient publicly available data and did not respond to our requests.
Appendix B provides the full table of detailed results, including participation status, for all 55 foundations in the study.
Based on investor and manager feedback, we raised the threshold for what is considered diverse ownership from more than 0% to 50% or more, a threshold set by the commonly used industry databases.6 Of the 30 Participating Foundations, the study finds that $11.07 billion (16.6%) of $66.73 billion in Analyzed AUM is invested with diverse-owned firms. Raising the bar on the diversity definition serves to reduce the overall diversity score in this study by approximately 3.3 percentage points, to 16.6% from what would have been 19.9% using the 2020 definition.
Table A shows the results of the study for the Participating Foundations, ranked by total assets. Silicon Valley Community Foundation, Tulsa Community Foundation/George Kaiser Family Foundation, Casey Family Programs, and the John S. and James L. Knight Foundation have more than 30% of their portfolios invested with diverse-owned firms.7
There is still room for improvement in terms of study participation rates. Fourteen foundations elected not to disclose diversity statistics at all by either declining to participate or not responding to our requests. Table B lists the other foundations organized by participation status.
Several Participating Foundations noted that publicly traded and widely held firms may not meet the study’s definition of diverse-owned firms and that the ownership composition of those firms is not available in the public data. In response to this feedback, we conducted a second version of the diversity analysis that excludes publicly traded firms and Vanguard (a widely held firm, owned by its investors) and focuses only on traditionally held, non-public firms for which we know the ownership composition. Notably, 15% ($9.81 billion) of Analyzed AUM is invested with publicly traded and widely held firms. Table C shows the results from this version of the analysis and finds that $11.02 billion (19.4%) of $56.92 billion in Analyzed AUM is invested with diverse-owned firms.
Comparison with the 2020 Diversity of Asset Managers in Philanthropy Study
The results of the 2020 study cannot be directly compared with the results of the 2021 study presented above for two main reasons: We have raised the threshold for diversity, and the diversity data has evolved. To compare the 2020 results with the 2021 results, we retroactively apply the 2021 diversity data and higher ownership thresholds to the 2020 foundation portfolio data and then assess changes in the diversity of the asset managers used over time by the 25 foundations that participated in both the 2020 and 2021 studies.8
After applying those two adjustments and comparing the 25 foundations with data in both studies, we find that there was a 1.1-percentage-point increase in the amount of Analyzed AUM invested with diverse-owned firms overall, from 15% in 2020 to 16.1% in this study. The increase was focused in minority-owned firms, as the percentage of investment dollars placed with women-owned firms stayed constant at 9.8%, but there was a 1.2-percentage-point increase in the amount invested with minority-owned firms, from 8.2% to 9.4%. Table D shows the results of the overall comparison.
In refreshing this study, we also observe improved transparency in foundation investments. We observe higher foundation participation, with five new foundations engaging in the study: W.K. Kellogg Foundation, the California Endowment, the Duke Endowment, the Harry and Jeanette Weinberg Foundation, and Cleveland Foundation. With the inclusion of those five foundations, we have gained insight into an additional $11.03 billion in Analyzed AUM, providing a more complete picture of the diversity in asset management in the nation’s largest foundations.
The Relationship between Diversity of Ownership and Diversity of Portfolio Management Teams
The Diversity of Asset Managers in Philanthropy studies have focused on diversity of ownership of investment firms, a diversity metric widely reported in the industry databases Preqin and eVestment. Recognizing the inherent limitations of relying on a single dimension to assess firm diversity in all its complexities, several foundations and others have asked whether diverse ownership in asset management firms is a marker for other measures of firm diversity such as diversity of firm employees. In other words, a question of interest is: Are diverse-owned firms employing diverse teams?
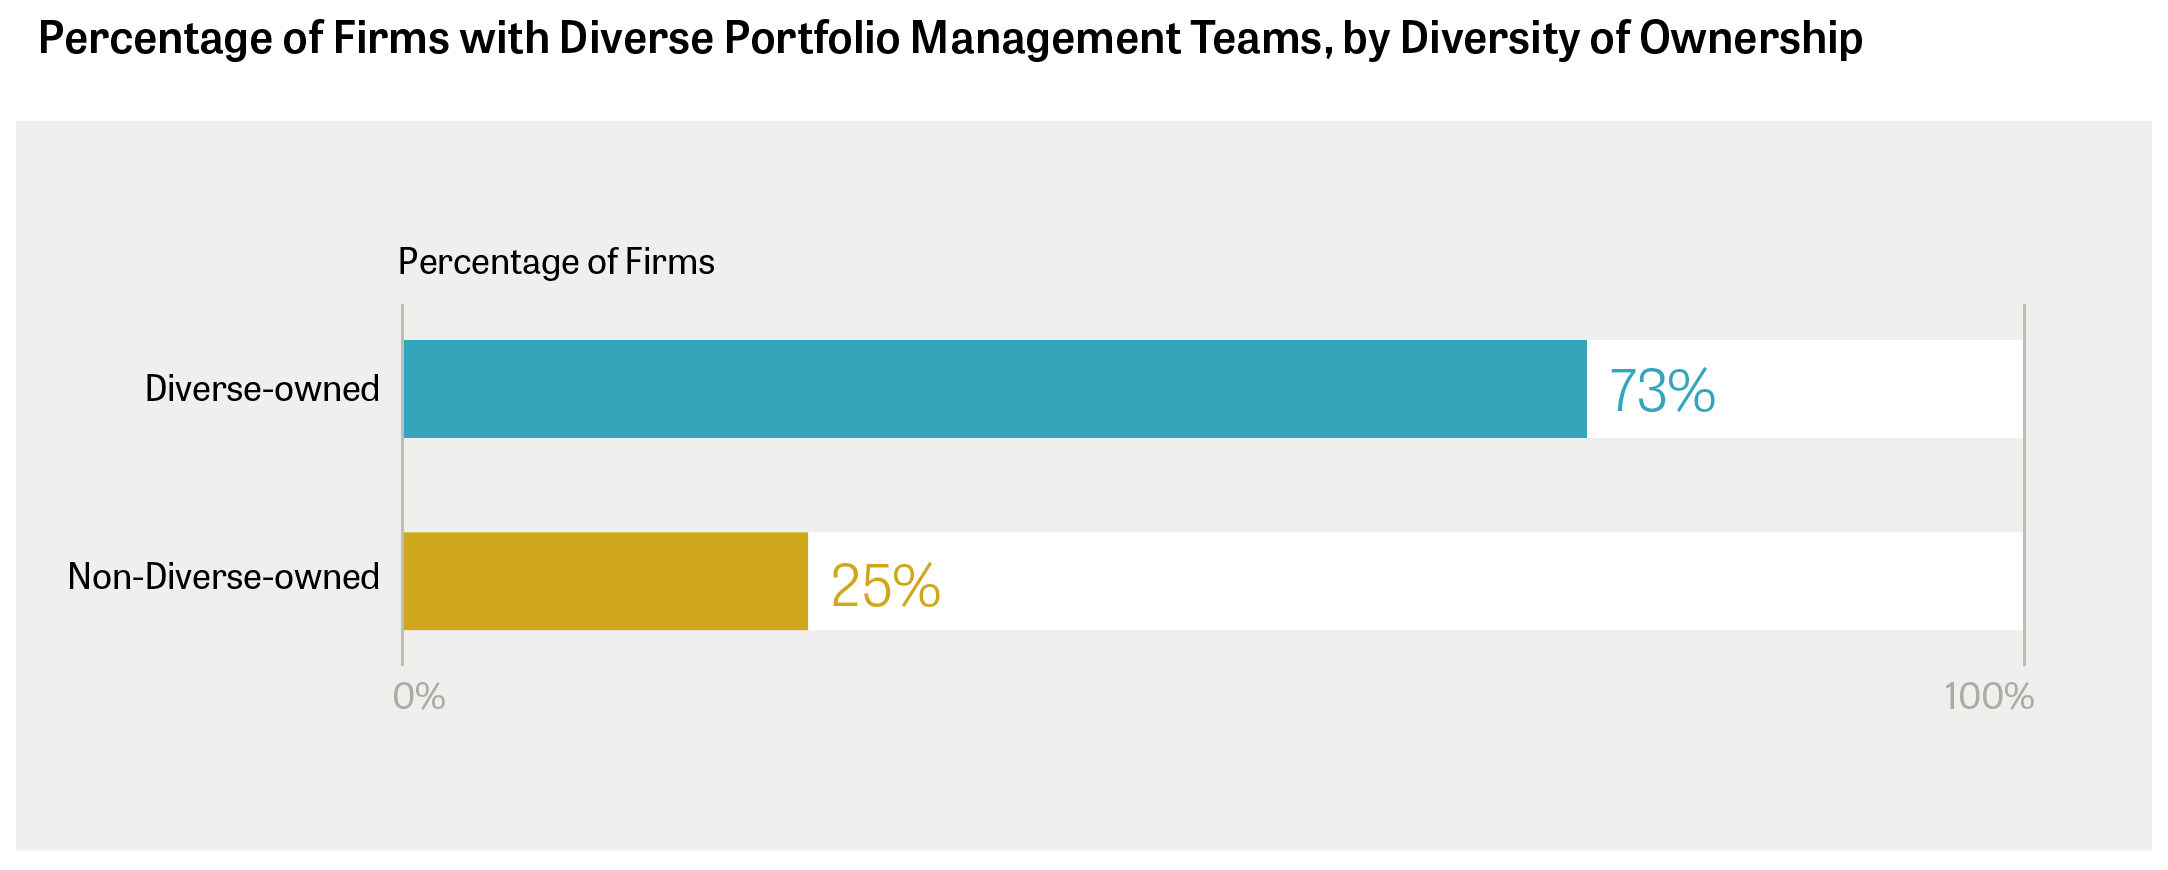
In January 2021, eVestment began collecting diversity data on portfolio management teams, making it possible to begin evaluating the answer to that question based on a sample of firms. The new diversity metric includes high-level portfolio decision makers (e.g., portfolio managers and portfolio analysts), and is not a measure of overall firm composition. Because this metric considers a greater number of people in decision making roles and not just firm ownership shares, it provides insight into what is often referred to as the “diversity of opportunity” within a firm. Analyzing available data on 213 traditionally held (non-public) U.S.-based firms, we find a strong positive correlation between the percentage of firm ownership held by diverse owners and the percentage of the firm’s portfolio management team composed of diverse team members, with a correlation coefficient of 0.7. In addition, applying a diversity threshold of 50% or more to ownership share and team composition, we also find that diverse-owned firms are nearly three times as likely to have diverse portfolio management teams than firms that are not diverse-owned.9 More specifically, as shown in the chart below, we find that 71 of the 97 diverse-owned firms (or 73%) have diverse portfolio management teams compared with only 29 of 116 (25%) for firms that are not diverse-owned.10
Conclusion
To summarize, using a higher threshold of diverse ownership for 2021 (50%) compared with 2020, the study finds that for 30 of the top 55 foundations, $11.07 billion of $66.73 billion in Analyzed AUM (16.6%) is invested with diverse-owned firms.11 When publicly traded firms and Vanguard are excluded from investment portfolios, the study finds $11.02 billion of $56.92 billion in Analyzed AUM (19.4%) is invested with diverse-owned firms. Also, compared with the 2020 study, we observe (1) increased investing with diverse-owned firms overall among the 25 foundations that participated in both studies and (2) higher foundation participation, with five additional foundations participating in the study. That said, there is still room for improvement in study participation, as 14 out of the top 55 foundations elected not to disclose diversity statistics or data at all.
Download the full report:
REFLECTIONS FROM THE FIELD


FURTHER READING
America’s top foundations overwhelmingly invest their assets through white male-led firms, but a new study sees growing commitment to diversity